Analytics

Graphic representation of your business operations

GRAPHIC REPRESENTATION OF YOUR BUSINESS OPERATIONS

All analytical data in one place and in real time

Applicability of Analytics

Analytics prepares graphic representations of your business operations at various levels.

With Analytics you can do the following:

Monitor your data in Analytics and make the right business decisions.

Analytics enables a simple, transparent overview of data that are crucial for your business.

Analytics enables mass data management and presentation.

1.

Display sales numbers for a selected time period

Analytics displays sales in real time and different filters can be used:

  • Sales by web shops
  • Sales by countries
  • Sales by items
  • Sales by categories
  • Value of orders
  • Record of cancelled orders
2.

Inventory display

Display of the current inventory and free stock (reservations taken into consideration) and prediction of stock of individual items.

3.

Delivery charts

Analytics offers a wide range of delivery charts where you can monitor:

  •            Delivery times of individual delivery services

  •       Delivery success rates

  • Success rates of delivery relative to the speed of internal order processing
  • Individual delivery events
  • Delivery success rates relative to individual delivery events

User experience and value of Analytics

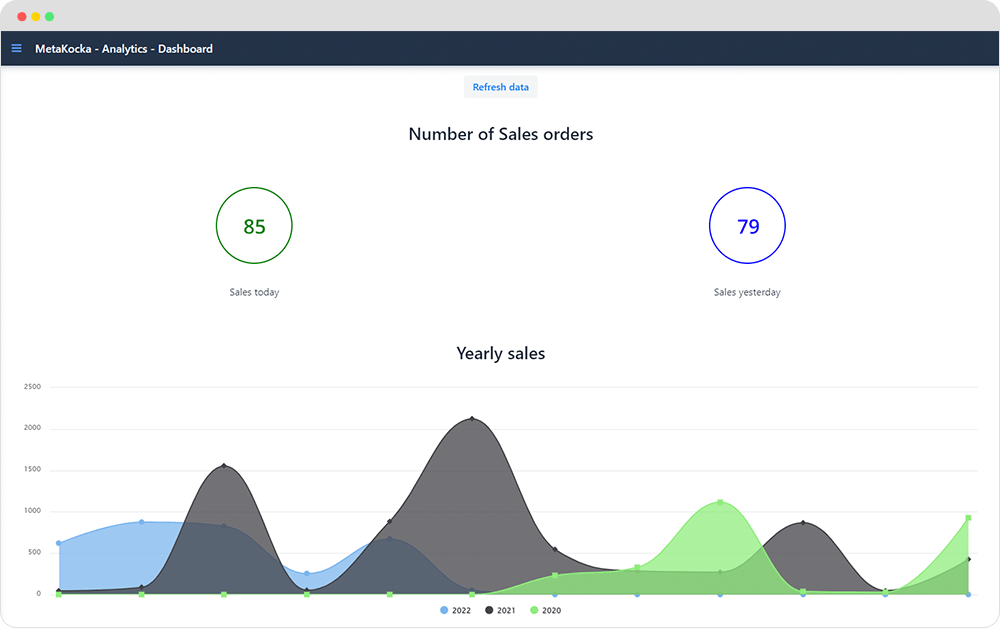
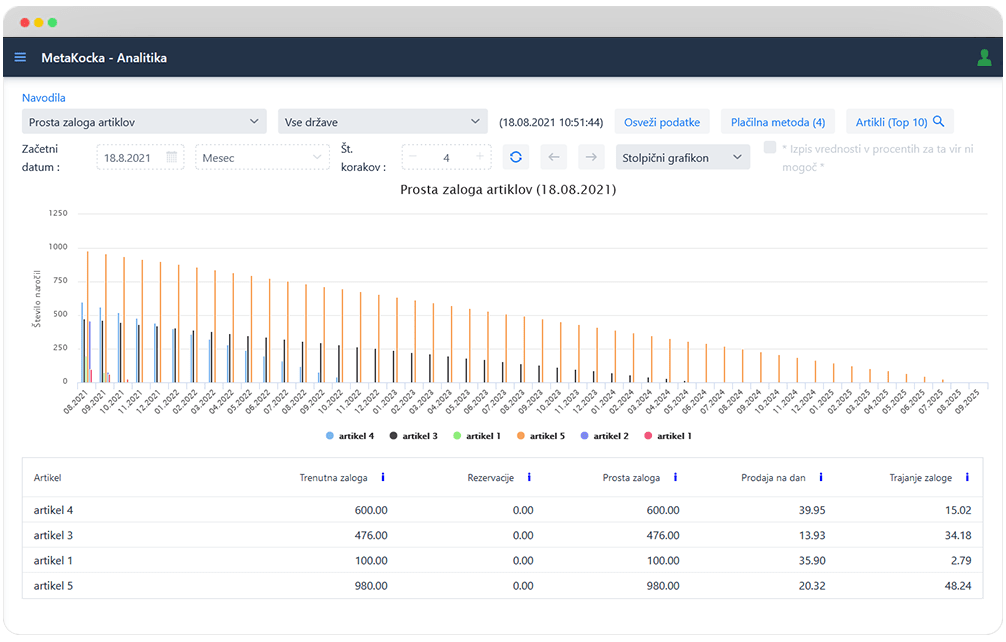
With Analytics we improved our insight into delivery events, which allows us to identify problems, errors and complications in the delivery process sooner.


Based on up-to-date analytics data, coordination with the delivery service is faster and easier, which improves the delivery rates of our shipments.


Bogdan, HS PLUS 

Scroll to Top